1. Introduction
Open Privacy Vault (OPV) - Secure, Performant, Open Source PII as a Service. The goal of OPV is to provide an open standard of PII management. With Structural PII validation, performant APIs, pluggable databases, extendabale encryption and hashing engine, flexible policy and authorization, we are aiming to bring the highest open standard for the fair usage of PII.
Quick Start
Running Local OPV
Note that all the configuration of OPV is done through environment variables.
For example, setting OPV_DB_DRIVER=mysql. See Env Configuration →.
Start with docker.
# Control Plane

docker run -it \
  -v /tmp/opv_data:/data \
  -p 27999:27999 \
  openprivacyio/opv \
  controlplane
# Data Plane

docker run -it \
  -v /tmp/opv_data:/data \
  -p 28000:28000 \
  openprivacyio/opv \
  dataplane
# Proxy Plane (Depends on Data Plane, and a grant token created from Control Plane)

docker run -it \
  -v /tmp/opv_data:/data \
  -p 28001:28001 \
  -e OPV_PROXY_PLANE_DEFAULT_DP_BASE_URL='http://127.0.0.1:28000' \
  -e OPV_PROXY_PLANE_DEFAULT_DP_GRANT_TOKEN='grant_token_that_can_read_write_facts' \
  openprivacyio/opv \
  proxyplane
Start from source code:
git clone https://github.com/open-privacy/opv
cd opv
make vendor

# Start the control plane and data plane
make run

# Start the proxyplane (optional)
OPV_PROXY_PLANE_DEFAULT_DP_GRANT_TOKEN=<grant_token_that_can_read_write_facts> make run_proxyplane
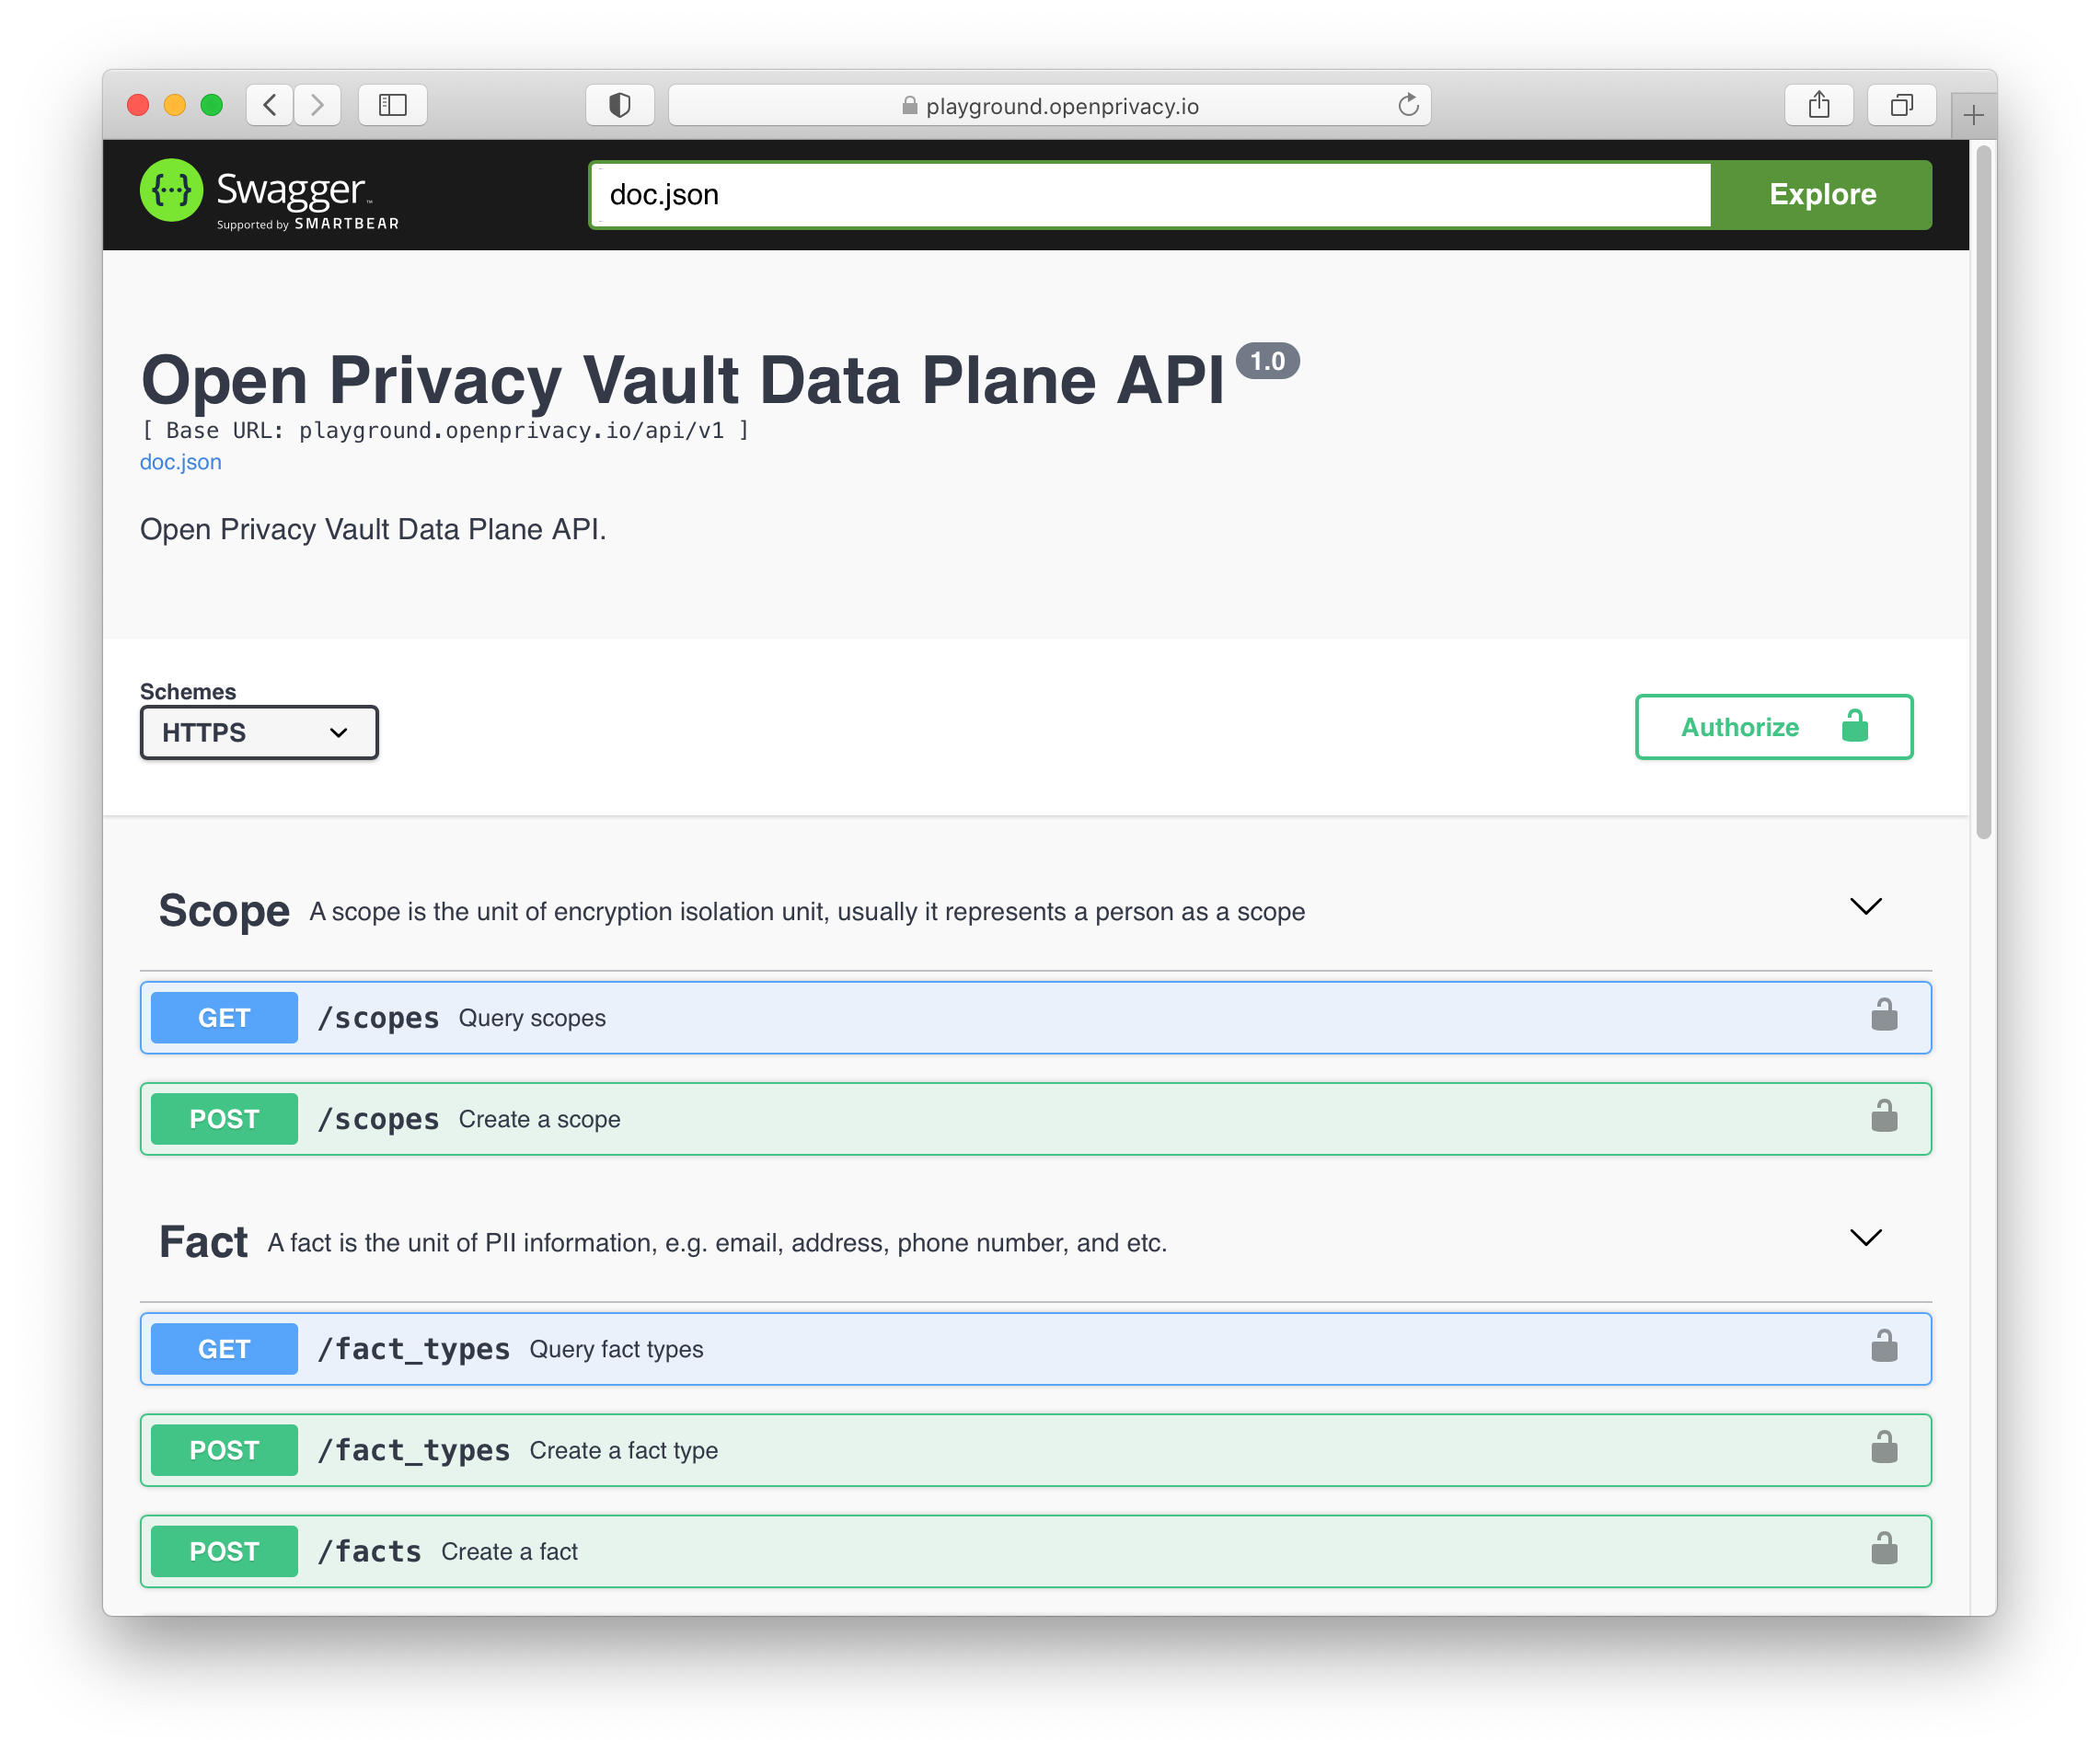
Try it with the playground:
- https://playground.openprivacy.io/swagger/index.html
- A testing domain
sandbox.example.comgrant token (v1:sandbox.example.com:Iy8TJZcuhicocCklFdwA) can be used to test the playground. It has the permission to access to all the paths and http methods of the dataplane within the domain ofsandbox.example.com.
{
  "token": "v1:sandbox.example.com:Iy8TJZcuhicocCklFdwA",
  "domain": "sandbox.example.com",
  "allowed_http_methods": ["*"],
  "paths": ["*"]
}
APIs
For more information, please take a look at
Now you can test the APIs with curl.
# Create a new grant token from the control plane http://127.0.0.1:27999

curl -X POST 'http://127.0.0.1:27999/api/v1/grants' \
--header 'Content-Type: application/json' \
--data-raw '{
        "allowed_http_methods": ["*"],
        "paths": ["*"],
        "domain": "sandbox.example.com"
}'


# The response will give you a grant token for data plane access
# You can pass the token via HTTP header X-OPV-GRANT-TOKEN
{
  "token": "v1:sandbox.example.com:Iy8TJZcuhicocCklFdwA",
  "domain": "sandbox.example.com",
  "allowed_http_methods": ["*"],
  "paths": ["*"]
}
# Store a new fact by calling the data plane http://127.0.0.1:28000
# Please replace the token with the token you just got above

curl -X POST 'http://127.0.0.1:28000/api/v1/facts' \
-H 'Content-Type: application/json' \
-H 'X-OPV-GRANT-TOKEN: v1:sandbox.example.com:Iy8TJZcuhicocCklFdwA' \
--data-raw '{
        "fact_type_slug": "ssn",
        "value": "123-45-6789"
}'
One can open the local swagger UI to test the APIs:
- Default Control Plane Swagger URL:
- Default Data Plane Swagger URL:
One can also test the proxyplane:
- Default Proxy Plane Port: http://127.0.0.1:28001
- The routes of the proxy plane are defined at opv-proxyplane-http.example.json. Learn more at Proxy Plane Config →.
Performance
Endpoint Latency
We are expecting to see P99 < 10ms latency when sending GET requests to /api/v1/facts/:id,
which is the most heavily used endpoint to retrieve PIIs from a tokinized fact. We did some simple
benchmarking (nowhere near perfert of course), to keep tracking the performance of the GET endpoints.
#!/bin/sh

# Make sure you have vegeta downlaoded. https://github.com/tsenart/vegeta
# Replace the X-Opv-Grant-Token and fact_id for the benchmark script

echo $'GET http://127.0.0.1:28000/api/v1/facts/fact_1LqMuvudjA1xdtqbjd0l \nX-Opv-Grant-Token: v1:sandbox.example.com:Iy8TJZcuhicocCklFdwA' \
    | vegeta attack -duration=10s | vegeta report

# Example of the result
# $ sh vegeta.sh

# Requests      [total, rate, throughput]         500, 50.11, 50.11
# Duration      [total, attack, wait]             9.978s, 9.977s, 1.17ms
# Latencies     [min, mean, 50, 90, 95, 99, max]  753.995µs, 1.679ms, 1.415ms, 2.564ms, 3.061ms, 6.926ms, 12.096ms
# Bytes In      [total, mean]                     62000, 124.00
# Bytes Out     [total, mean]                     0, 0.00
# Success       [ratio]                           100.00%
# Status Codes  [code:count]                      200:500
# Error Set:
Prometheus Monitoring
By default, prometheus metrics are enabled for both data plane and control plane (controlled
by the environment variable OPV_PROMETHEUS_ENABLED). You can easily connect your prometheus
scraper with the following config:
scrape_configs:
  - job_name: opv-metrics
    metrics_path: /metrics
    static_configs:
      - targets:
          - "opv_controlplane:27999"   # replace it with the actual controlplane's base URL
          - "opv_dataplane:28000"      # replace it with the actual dataplane's base URL
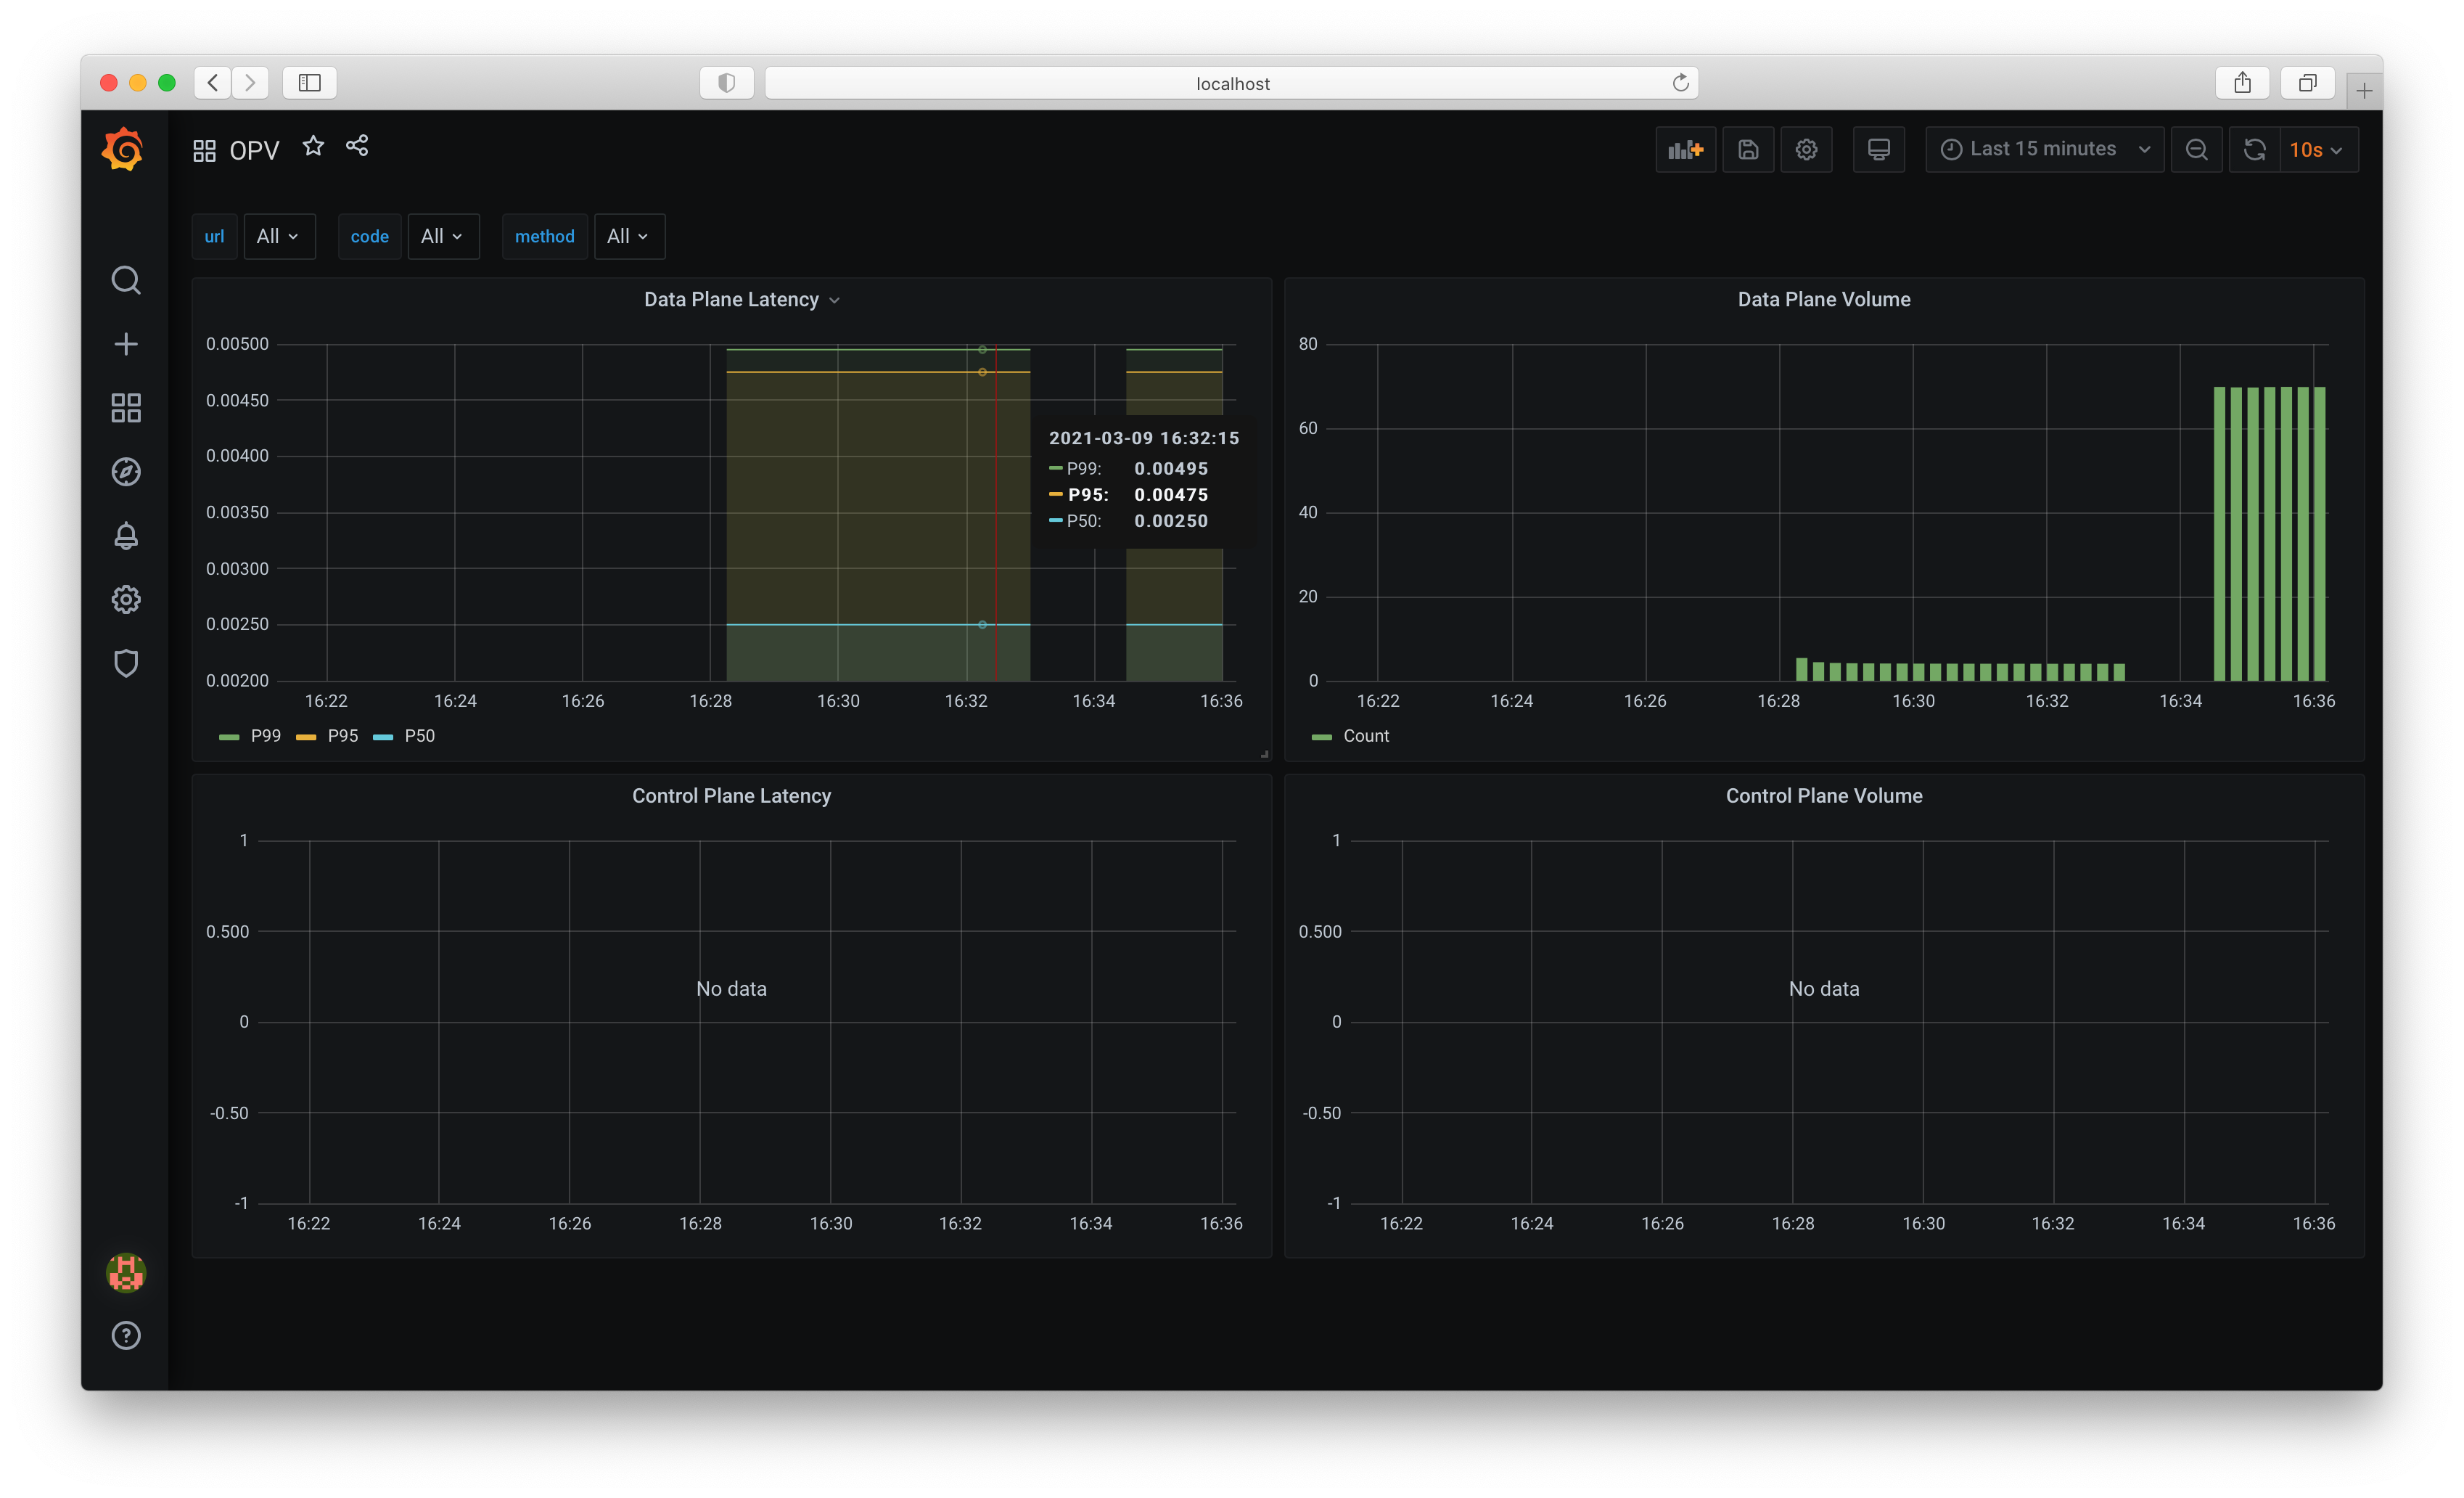
For local benchmarking, we created a docker-compose network to test the prometheus and grafana, and we can closely monitor the performance regression.
cd ./benchmark
docker-compse up --build